

It’s Monday morning and we’re back in the office. John, sunburn from a long weekend of golfing, has come in and loves the report we created. However, he’s getting savvy and now has a few new requirements.
John loves the simple email marketing report which we created. However, he thinks it would be better if we could create a report which summarizes all website marketing mediums and that we associate these with the campaigns, traffic and revenue generated.
In this lesson, we’re going to follow the same steps:
- Report Planning: We’re going to outline what our report needs to accomplish.
- Basic Setup: We’re going to create the report.
- Report Metrics: Assign the metrics (quantitative values)
- Report Dimensions: Dimensions in this case are the “campaigns”.
- Report Filters: Assign needed filters.
- Report Testing: Does the report do what we meant it to do?
- Report Sharing Options: Review the sharing options.
Onward!
Let’s Build a Dummy (report)!
Step 1: Planning
John wants to see each marketing channel and then wants to be able to drill down to view each related campaign and the revenue generated.
Let’s outline this in bullet points:
- Monthly report (hasn’t changed)
- Shows
only email marketing trafficALL traffic - Shows all
emailcampaigns - Relates revenue to each campaign
- Relates traffic (sessions) to each campaign
That’s it, now let’s start building it!
Step 2: Basic Setup
Now, let’s create the report.
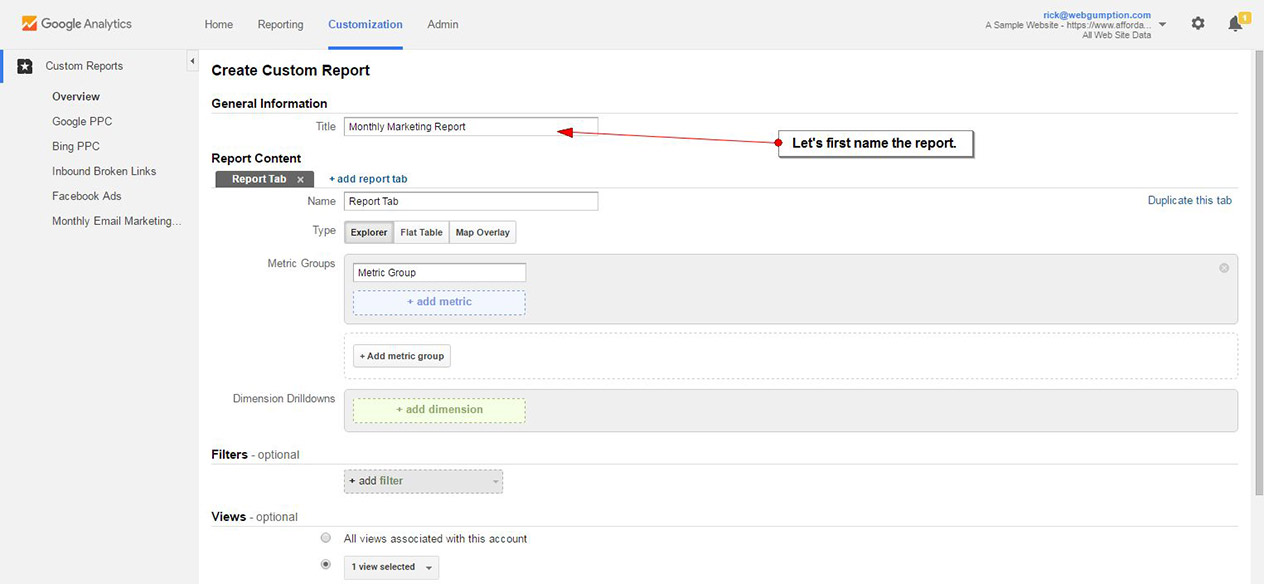
- Click the “Customization” link on the Google Analytics top navigation bar.
- Click “New Custom Report”
- Name the report: Monthly Marketing Report
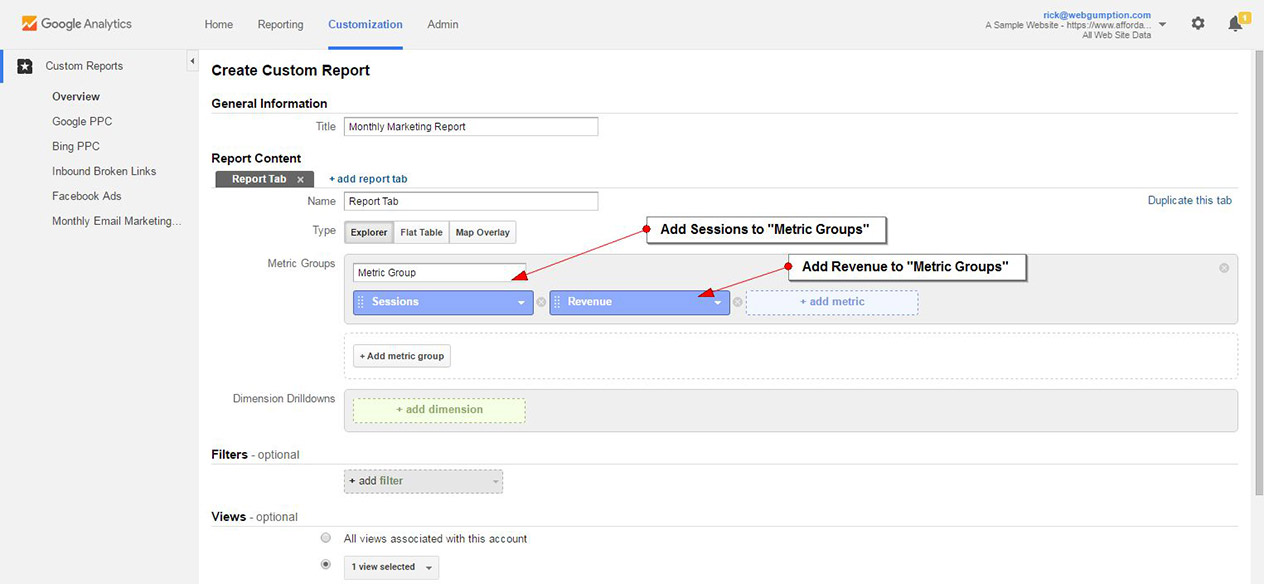
Step 3: Report Metrics
Metrics are quantitative. For this report, John said he wants to see the number of sessions and revenue for each campaign.
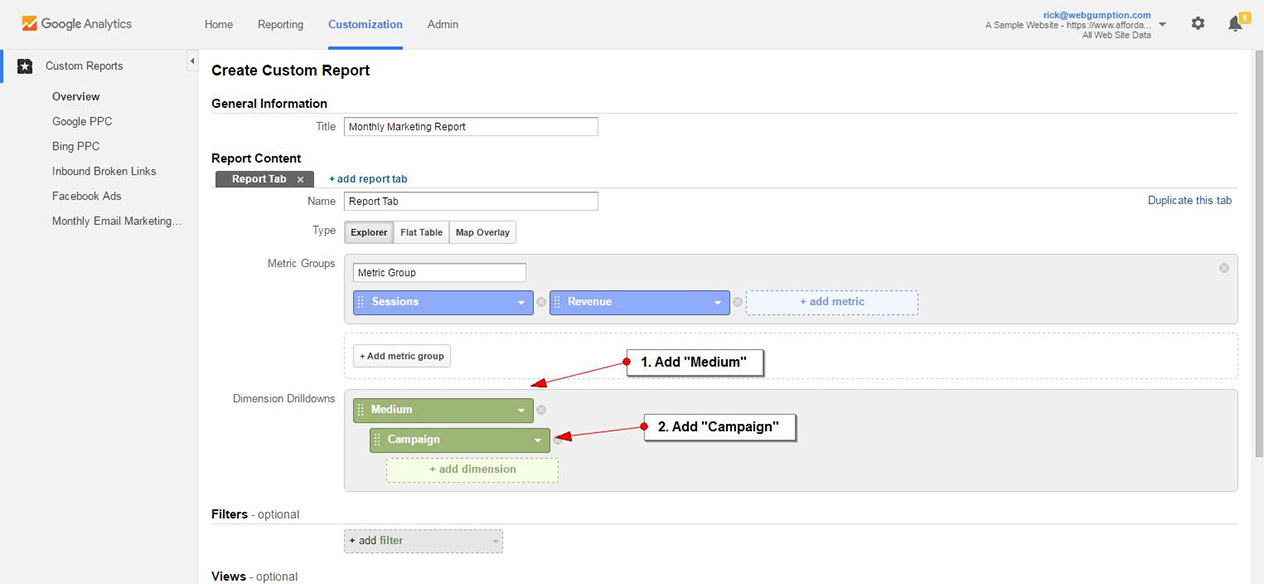
Step 4: Report Dimensions
Think of dimensions as being everything that is not quantitative. They include “categories” for which we want to view our Metrics. In this case, John has asked to see the channel (we’re going to use ‘medium’) and campaign name as it relates to traffic and revenue. Our dimensions are going to be Medium and Campaign. We’ll put Medium on top so that we can drill down to see campaigns.
Step 5: Report Filters
John has asked to see a report with ALL traffic so w won’t set any filter. Instead, we’ll just click “Save” and check out our report.
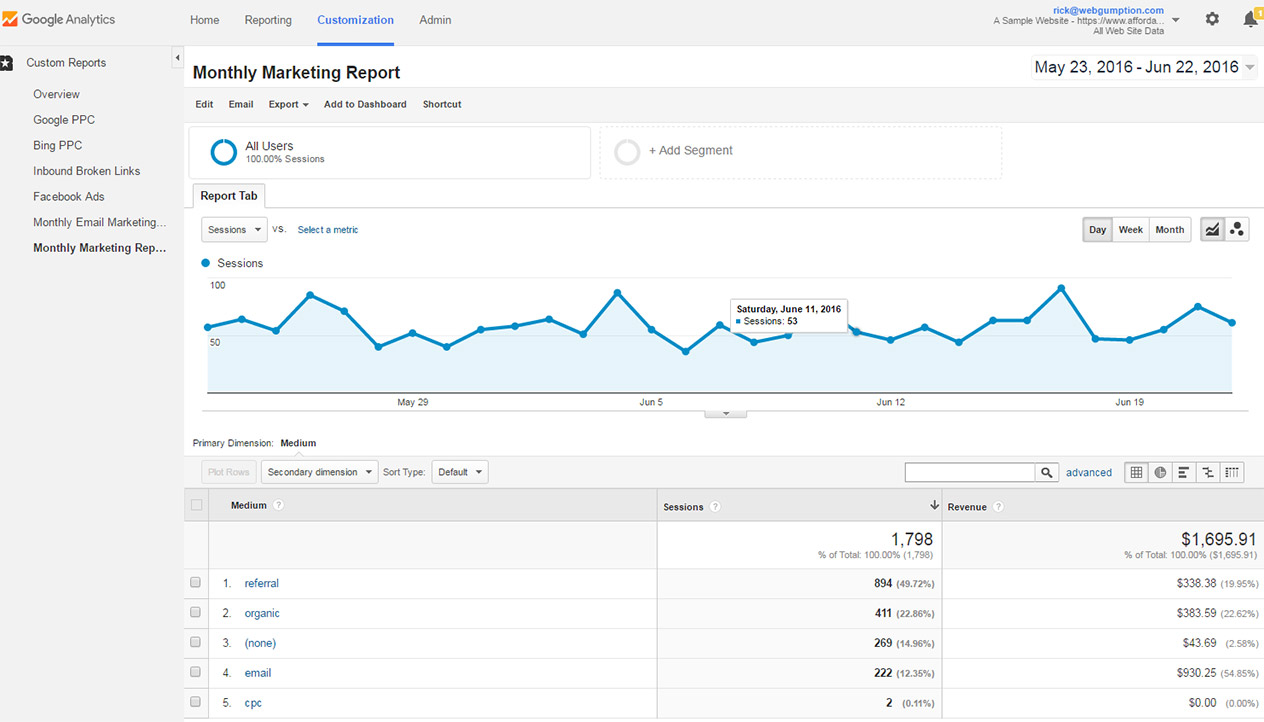
Step 6: Test
After saving the report, you’ll be redirected to view the report. Is this what John asked for? We see a pretty simply report with 3 columns- Medium, Sessions and Revenue. This gives John a high-level view of all the basic marketing mediums that we advertise in. Now, when he clicks on any one medium, he gets to see the campaigns associated.
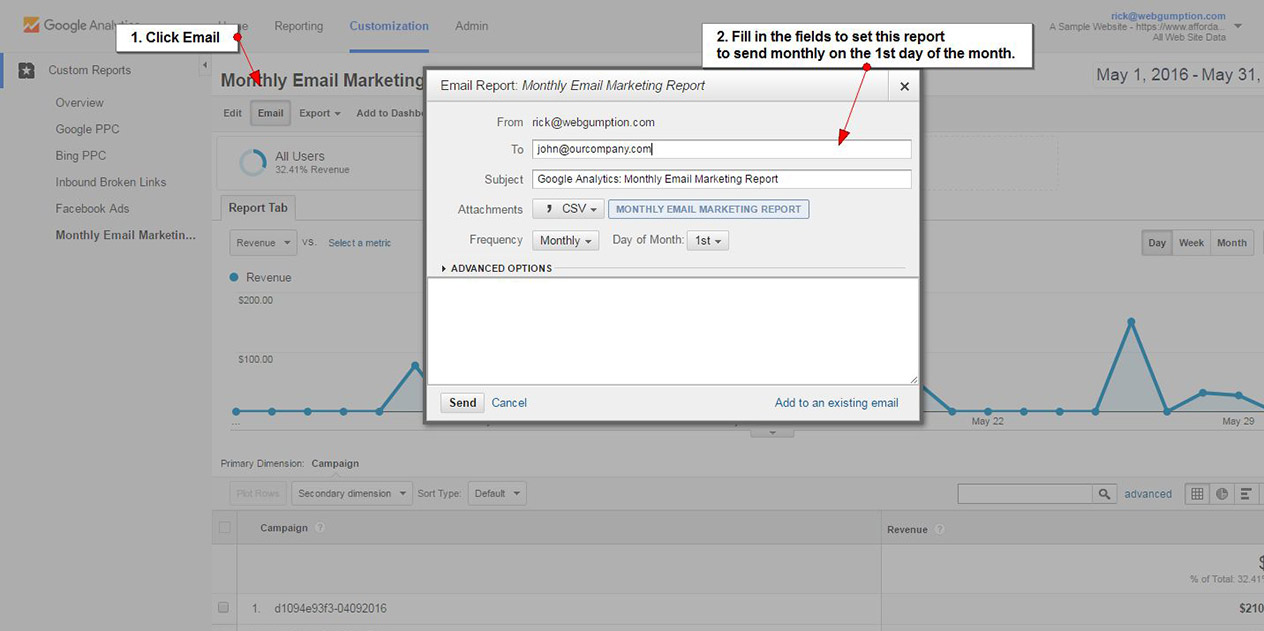
Step 7: Sharing
Sharing is easy. Note that above the report chart there’s a button which says “email”. Click that to configure how you want to share the report. You can share it one time or set a recurring automated report.
 I don’t know about you but I’m starting to think that our holiday bonus is going to be sweet!
Leave A Comment