

Overview
There are a few different parts of the Screaming Frog interface which it’s important to understand.
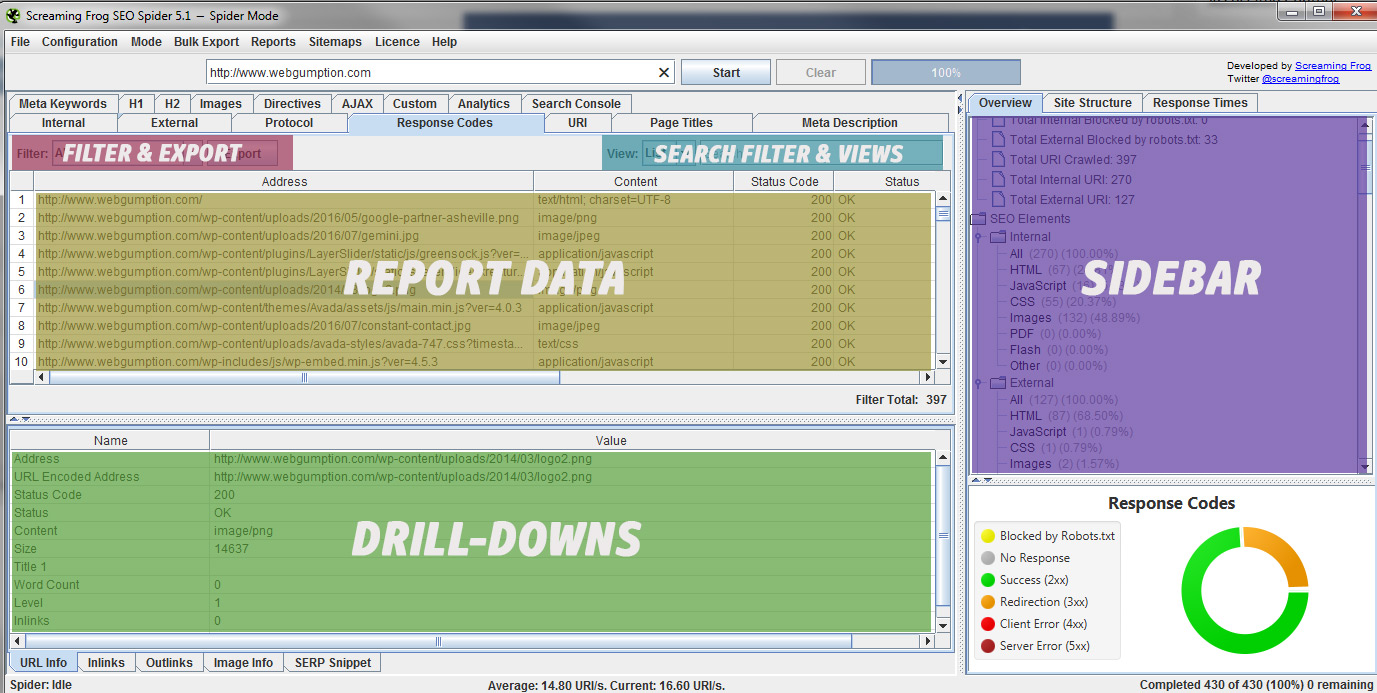
Report Data and Columns
Front and center is the report data itself. In this section, you see report-specific data is a tabular format.
Drill-Downs
By highlighting any file in the data section, you’ll notice that the Detail Navigation engages and provides a whole new set of options. Use the Detail Navigation to get more information on a specific file (html, image, css, etc.).
Export Option
In any given report, you have the ability to export the data you see. Simply click the export button to export in formats which include CSV, XLS, XLSX.
Search Filters and Views
The search bar, filters, and view are the secret sauce in all this! Screaming Frog provides tons of data but knowing when and how to view it is key to making it actionable!
- Search Bar: The Search Bar allows you to filter the results of any data column based on the criteria you choose.
- Filter Drop-Down: The Filter tool provides a set of predefined filters which are specific and appropriate to the report which you are viewing.
- View Toggle: The View Toggle allows you to shift between tabular view and tree view. In some cases, it will be easier to switch back and forth.
Sidebar
The Sidebar section has a couple functions. First, it provides a quick way to navigate between reports. It also provides a quantitative breakdown specific to different reports.
So happy you guys made this course.
We’ve used it for quite some time now, and it helps us optimize our clients website a great deal.
We are also very fond of AhRefs new Site Audit Tool.
What pros and cons do you find in the Ahrefs Site audit that Screming Frog doesn’t have and vice versa?
Thanks